Progressboard/United States
Status 14 July 2024.
The explanation of these graphs can be found on this page.
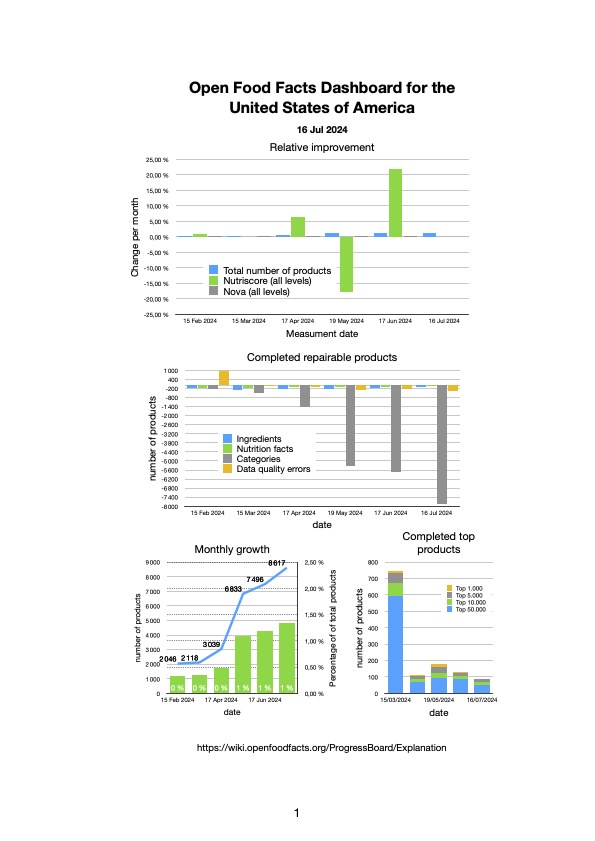
Monthly improvement graph
- Nutriscore and NOVA completeness can NOT keep up with growth (below blue);
Monthly growth graph
- Growth around 1.3%, i.e. 8617 products.
Completable products graph
- A lot of products without category have been added (below zero);
- Data quality decreased;
Completable top products graph
- Some 90 completable top products have been completed;
